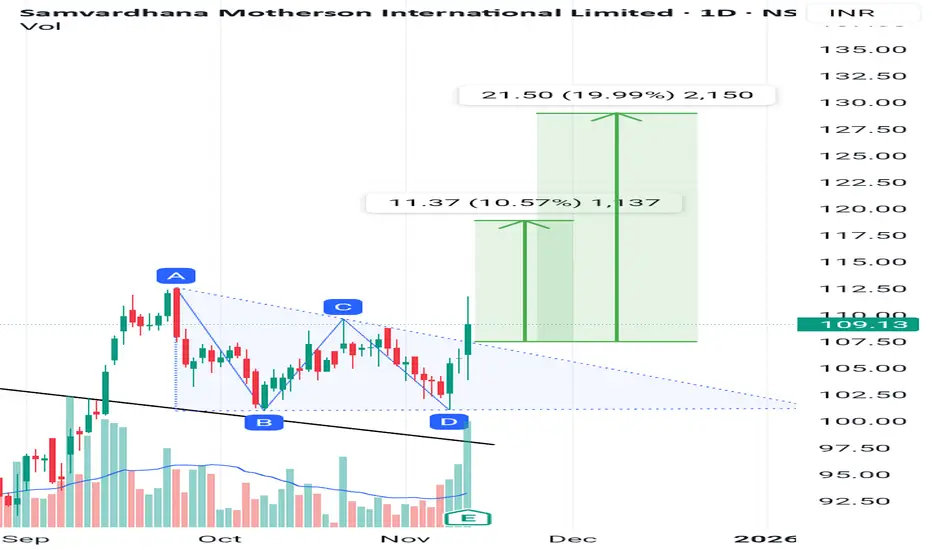
Samvardhana Motherson just made a triangle breakout.will it sustJust broke out of triangle pattern with good volume spike. Volumes are 3 times the average.
It brokeout of treandline on 12 September and gave a move of 10% before entring into consolidation of triangle pattern.
It just broke out of the pattern giving bullish signal.
Indicators
RSI is >60 which is a bullish signal
ADX is still weak at 13.38 although rising when compared to day before when it was 10.9
Entry at 110 looks safe
Might retrace till 100
SL at 95
Target at 119--130
Community ideas
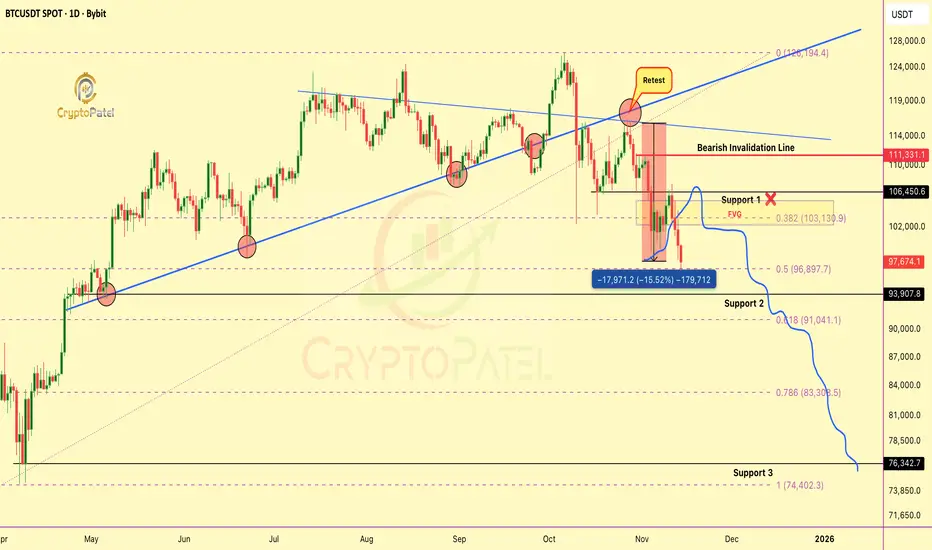
bearish retest I warned on Oct31 played out EXACTLY as projectedThe bearish retest I warned about on Oct 31 played out EXACTLY as projected
I clearly said CRYPTOCAP:BTC would dump again after filling the FVG at $106K–$107K and that’s exactly what happened.
BTC dropped from $107K → $98K (-9%) and from our retest entry, we’re now 15% in profit.
Hope you enjoyed the analysis and booked gains.
Now watch the 0.5–0.618 FIB zone closely.
✔️ If it holds → strong bounce possible
❌ If it fails → BTC could slide below $80K
I’ve been warning about this dump since BTC was above $120K+.
Structure always wins.
NFA & DYOR
Asian Paints Turns Colorful Again!Hello Mates! Here’s a chart that really caught my attention this week Asian Paints showing strength after a long phase of quiet sideways movement. The structure is clean, the breakout is sharp, and the message from price action is clear momentum is shifting again.
After spending almost two years inside a broad consolidation zone between 3600 and 2600 (blue box), the stock finally formed a smaller accumulation base between 2200 and 2600 (green box). Within this base, price consistently made higher lows, hinting at renewed buying interest.
Now a strong breakout above the upper boundary of this smaller channel backed by volume confirms that buyers are regaining control.
A short term retest near 2650–2700 could offer an ideal pullback entry before continuation.
Technically two targets come into play-:
Target 1: The falling resistance trendline near ₹3100.
Target 2: falling resistance line breakout can lead this move toward 3600, which also aligns with the upper blue supply zone the same area that capped price for nearly two years.
Overall, this looks like a base-to-base transition where a fresh uptrend is emerging after a long consolidation. A sustained close above 3100 would further confirm this shift in structure.
Trading Insight-:
When higher lows meet a strong breakout, it often signals that the accumulation phase is ending and smart money is stepping back in.
Regards-- Amit.

XAUUSD Gold ShortI expect Gold to decline toward the 3700–3800 range. A trade can be considered with a stop-loss set at 4382, maintaining a risk-to-reward ratio of 1:1.5. Please do your own research before entering any trade.

XAUUSD: Continuing Uptrend with Potential Expansion to $4,280OANDA:XAUUSD has shown strong performance in the ascending channel, and I expect this trend to continue as shown in my chart, with a target price of $4,280.
The current area represents a key turning point, where prices could find support allowing them to rise, or they may break down, which could lead to a further downward movement.
If I were to choose the most likely direction, I would lean towards upward price movement. However, only market action will determine whether the channel will continue or not.
If the downtrend line is breached strongly, it will invalidate the bullish scenario, meaning that the bullish momentum could weaken or even reverse in the short term.
These are just my personal forecasts based on technical analysis, and they do not represent financial advice. Always make sure to verify your setups and manage risks wisely.
Wishing you successful and profitable trading!

Classic Case of Priced In Optimism & Intraday Liquidity TrapThe market’s behaviour on the Bihar election result day followed a pattern that repeats itself almost every time political outcomes are broadly expected. By the time counting began in the morning, the market had already made its real move. The rally from the 25,350 zone to the 26,000 area in the previous sessions had priced in the possibility of political continuity. Exit polls and early sentiment didn’t leave much room for a fresh surprise, and because of that, the result day itself turned out to be a range-bound session instead of a trend day.
The 5-minute chart shows exactly how the trap formed. The index opened firm, pushed towards 26,000, and immediately met selling pressure. Traders who entered on the assumption that a clear political mandate would trigger a one-way rally were trapped right at the open. Through the middle of the session, the market drifted back into a narrow band, forming lower highs and repeatedly slipping toward the 25,750 support. This is typical behaviour when a major event gets fully discounted before the actual announcement. Without fresh triggers, the market simply rotated around intraday liquidity.
Global cues didn’t help either. Asian markets were soft, risk sentiment was weak, and domestic buying lacked strength. Even with a favourable political outcome, the backdrop wasn’t strong enough to push the index beyond the 26,000 supply zone. This created a clean intraday squeeze: optimism at the open, hesitation through the day, and then a sharp reversal in the last half-hour.
The late spike—more than 100 points in a single 5-minute candle around 3 PM—was largely mechanical. It had the signature of short-covering, expiry-related adjustment, and institutional book-closing rather than genuine trend buying. Moves like this usually appear when intraday shorts square off and larger players rebalance their positions into the close.
The higher timeframe tells the same story. On the 1-hour chart, the index had already hit resistance earlier, and each attempt near 26,000 was met with supply. The trend remains intact on the broader scale, but momentum clearly slowed down once the market realised that the result did not introduce any new variable—it simply confirmed what was already anticipated.
Overall, this session was a textbook example of how markets behave when the news is entirely expected. The initial reaction pulls in emotional traders, the mid-day choppiness shakes out both sides, and the final burst is more about positioning than sentiment. Until Nifty closes decisively above 26,050 on strong breadth, the index is likely to stay in a sideways-to-cautious zone with support near 25,750.
In short, the market didn’t rally because there was nothing new to rally about. The optimism was already embedded in the previous move, and the result day turned into a classic liquidity trap rather than a directional breakout.

NQ1! 14/11/2025 outlookBias → Bearish
Large sell-off yesterday on both S&P 500 and Nasdaq.
Both filled week opening gaps and are holding below.
Another “b-shaped” daily profile yesterday indicating value is lower
Nasdaq closed inside 7th november's value area
Looking for value retest to 24,810 OR low of 24,708.25

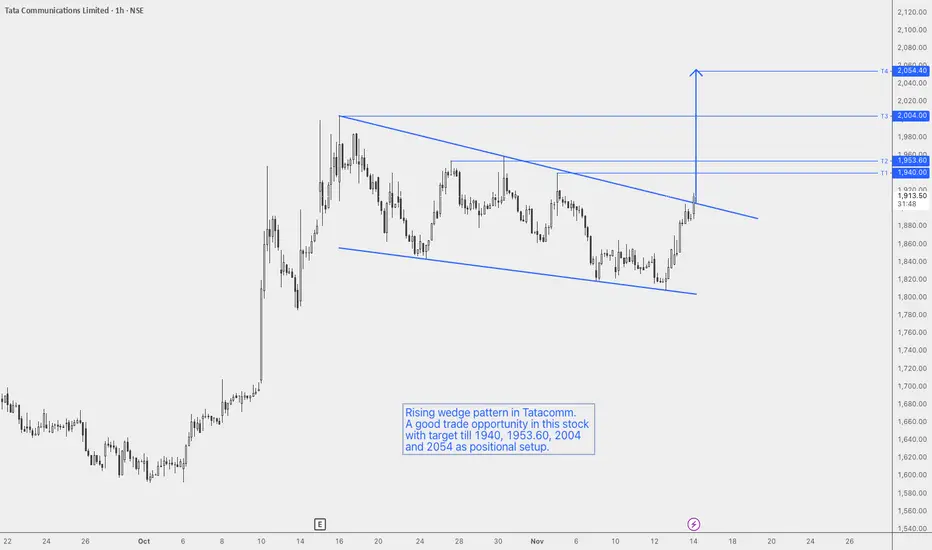
Rising Wedge in TatacommunicationsRising wedge pattern in Tatacomm.
A good trade opportunity in this stock with a target till 1940, 1953.60, 2004 and 2054 as a positional setup.
The pattern will be invalidated if the price reenters the wedge.
Validation for entry on breakout and test of wedge as support.
NIFTY getting rejected from BAT PRZ - To test 25730TF: 15 MInutes
Shared Sensex chart earlier today on this formation..
Price is getting rejected from the PRZ of the Harmonic Bat Pattern.
We could expect 50% pullback as per the set up, and the 50% retracement is placed at 25730
The PRZ also happens to be 1.618% fib extension from the lows, so, if one wants to consider it as a 3rd wave target..
Ideally, we could expect one more leg up to go past 26K after this correction (in EW terms), assuming, we have completed 3 and 4th in play (to end at 25700-25750 range)
Finally, the 25750 zone GAP needs to be filled sooner or later.. which, confluences with the Harmonic/EW targets.
lets see how the price unfolds in the coming sessions..
Disclaimer: I am not a SEBI registered Analyst and this is not a trading advise. Views are personal and for educational purpose only. Please consult your Financial Advisor for any investment decisions. Please consider my views only to get a different perspective (FOR or AGAINST your views). Please don't trade FNO based on my views. If you like my analysis and learnt something from it, please give a BOOST. Feel free to express your thoughts and questions in the comments section.

Thyrocare-A beautiful breakout is done!Thyrocare has given a good closing today above its previous ATH.
Stock has formed a beautiful rounding bottom pattern. Volumes buildup before breakout is decent as well.
Previously, i had covered Policybazar & Zomato with such patterns and they have given amazing returns.
Keep this stock in watchlist. This can give similar move as well.
Entering at ATH levels is tricky but these stocks come with excellent reward opportunity.
I am NISM certified RA and not SEBI registered.
This is not a recommendation but is shared for you to learn.

NATURALGAS - Approaching Harmonic CRAB PRZ (Short Term)
TF: 15 Minutes
CMP: 4.6464
Please note that this view is ONLY for the short term as the TF is 15 minutes. So plan your trade accordingly.
The ideal pattern target for the PRZ is 1.618 fib extension (of the XA leg) at 4.7740 and we should be expecting at least 50% pullback from that level.
If you are long, trail you SL strictly.
If you intend to play short here, better to wait for the price to reach and react at the PRZ zone and decide with better RR
Details are explained in the chart for better understanding.
Disclaimer: I am not a SEBI registered Analyst and this is not a trading advise. Views are personal and for educational purpose only. Please consult your Financial Advisor for any investment decisions. Please consider my views only to get a different perspective (FOR or AGAINST your views). Please don't trade FNO based on my views. If you like my analysis and learnt something from it, please give a BOOST. Feel free to express your thoughts and questions in the comments section.

Consolidation breakdown in eicher motors1. Consolidation range breakdown at top
below 6720 stock will test its Fibonacci support levels
2. stock has given big rally upwards
3. stock may test its fib support levels and the continue upward movement
4. one can watch for swing downside movement with strict targets and sl

Order Blocks Simplified — How Institutions Control Price🔥 Order Blocks Simplified — How Institutions Control Price
Order Blocks are one of the most important concepts in modern trading — because they show where institutions place REAL positions, not where retail traders guess. 🏦📊
When you understand Order Blocks, you stop chasing random candles and start reading the footprints of smart money. Let’s simplify it. 👇✨
📌 What Is an Order Block? 🧱💰
An Order Block (OB) is a price zone where big institutions (banks, hedge funds, market makers) place massive orders.
These zones often appear before strong market moves — because that’s where smart money builds positions.
Think of an Order Block as:
🔹 The origin of a powerful move
🔹 A zone where price reacts repeatedly
🔹 A region that creates imbalance and momentum
🔹 A point where institutional orders remain unfilled
Once price returns to that zone, institutions fill the rest of their orders, causing another strong reaction. ⚡📈📉
📌 Why Do Order Blocks Matter? 🧠🔥
Because institutions control 80%+ of market volume — not retail.
So when they accumulate or distribute positions:
📈 Trends are born
📉 Reversals appear
🌊 Momentum shifts
💥 Big candles print
Order Blocks give you insight into:
✔️ Where big players enter
✔️ Where real support/resistance exists
✔️ Why price reverses at specific zones
✔️ Where high-probability trades form
It’s the closest thing to tracking the “big money blueprint.”
📌 How Order Blocks Form 🛠️📊
Order Blocks are created during periods of:
🔸 Accumulation (smart money buys quietly)
🔸 Distribution (smart money sells quietly)
Then price explodes away from that zone, showing that a major order cluster was executed.
This explosive move creates:
🔥 Imbalance (FVG)
🔥 Break of structure (BOS)
🔥 A directional trend
These are all signs of institutional activity.
📌 Types of Order Blocks 🟥🟩
🟥 Bearish Order Block (B-OB)
The last bullish candle before a strong bearish move.
It marks institutional selling.
🟩 Bullish Order Block (B-OB)
The last bearish candle before a strong bullish move.
It marks institutional buying.
Both act as high-probability reaction zones.
📌 How Institutions Use Order Blocks 🎯🏦
Institutions don’t enter all at once — their orders are too large.
So they:
1️⃣ Place part of their order
2️⃣ Push price away
3️⃣ Wait for retracement
4️⃣ Fill the rest at the same zone
That zone = the Order Block.
Price returning to an OB is not random — it’s smart money completing their business. 💼✨
📌 How You Trade Order Blocks 🧘♂️📈
✔️ Identify the strong move
Big displacement = institutional interest. 🚀
✔️ Mark the Order Block candle
The last opposite candle before the move. 🔍
✔️ Wait for price to return
Smart money loves to rebalance orders. 🔁
✔️ Enter with confirmation
Candles + structure + reaction = high probability. 🎯
Order Blocks are not predictions — they are reaction zones with a smart-money edge.
📌 Why Order Blocks Work So Well 🌟
Because they are built on:
💧 Liquidity
🧠 Smart Money Behavior
📊 Market Structure
⚡ Supply & Demand
🔥 Institutional Order Flow
This is why OBs outperform classic support/resistance.
They show institutional reality, not retail imagination.
✨ Final Thoughts: The Power of Order Blocks 🚀
Once you learn Order Blocks, everything becomes clearer:
✔️ You know where big money enters
✔️ You know where to wait for price
✔️ You stop chasing bad trades
✔️ You trade WITH smart money
✔️ You catch cleaner, stronger moves
Order Blocks are the foundation of modern price action — simple, powerful, and deeply effective. 🔥📈
UTI AMC TECHNICAL ANALYSISUTI AMC TECHNICAL ANALYSIS
- Took monthly high
- Showing divergence
- there was no Fvg in monthly
- do might go to test swing , that might be the good level to pull back.
For education purpose only

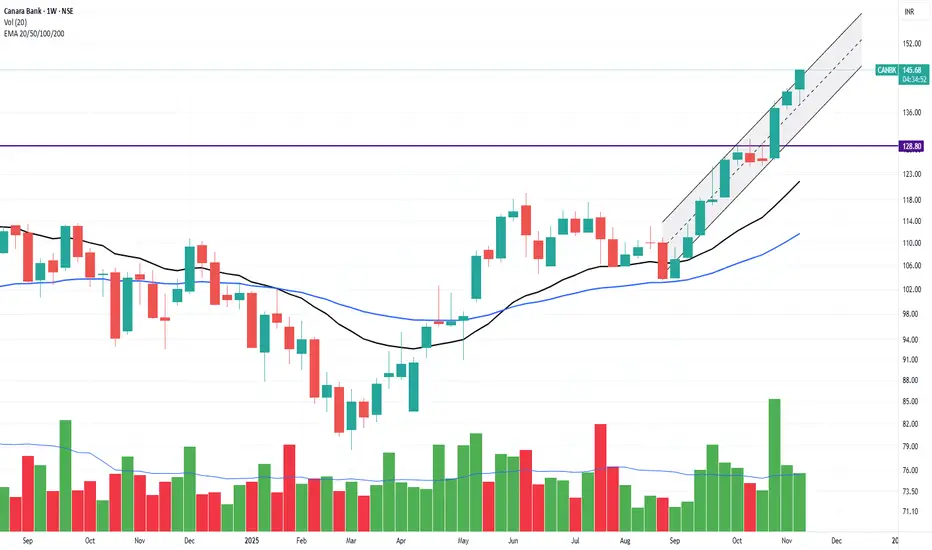
PSU BANK AVAILABLE AT FAIR VALUATION NOW: BREAKOUT IN CANARABANkAmong Indian PSU banks, Canara Bank currently stands out as available at a fair valuation, with a low price-to-earnings (P/E) ratio of around 6.6 and a price-to-book (P/B) value near 1.1, which makes it attractive compared to peers. Bank of India and Union Bank of India also screen as fairly valued, both hovering around P/E ratios of 6.3–6.9 and similar P/B multiples.
Notable PSU Banks for Fair Valuation
* Canara Bank: P/E 6.6, P/B 1.1, with strong return on equity (ROE) and return on assets (ROA), making it a value pick in current market conditions.
* Bank of India: P/E 6.9, P/B close to 1, and intrinsic value estimates within reasonable bounds for current prices.
* Union Bank of India: P/E 6.3, P/B 1.1, delivering consistent profit growth and maintaining attractive valuations.
Market Sentiment
With PSU banks reporting strong profit growth in recent quarters, the sector overall offers valuation support, but bottom-up stock selection remains vital. Canara Bank and Bank of India are currently among the most fairly valued, making them stand out for investors seeking value in the PSU banking segment.
For a long-term perspective, review each bank's NPA ratios, consistent profitability, and any recent regulatory changes that could impact valuations.
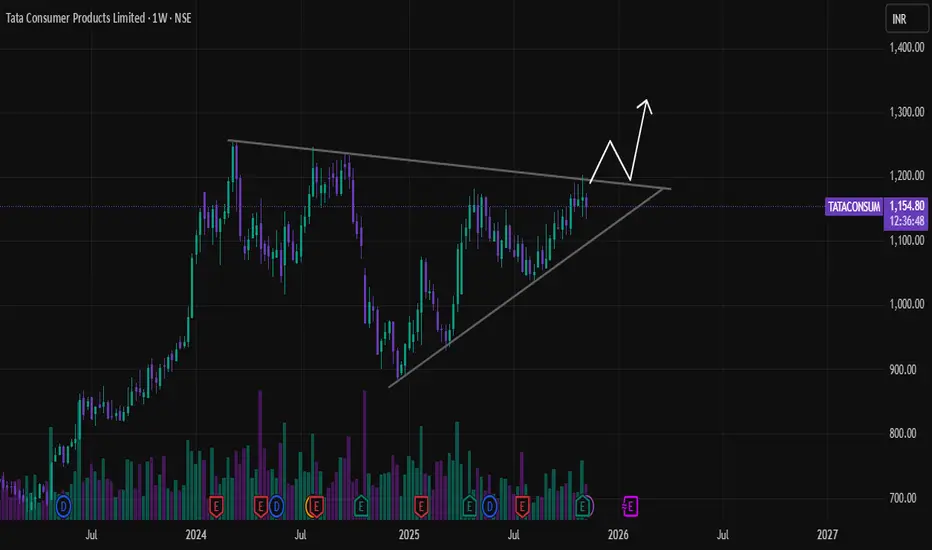
Tata Consumer – Weekly Symmetrical Triangle Breakout SetupIf the price breaks above the upper trendline with volume, it may begin a fresh uptrend toward 1,250–1,320 levels in the coming weeks
Data Patterns (India) Ltd. (DATAPATTNS)Time Cycle is a routine that allows you to map the movement of a stock by measuring the high and low levels of the stock on a day or period. However, it does not prove whether a reversal will occur in the next time cycle; it is only a probability. But it makes you profitable 80% of the time.
Regardless of the outcome, the candle formed on the day of the time cycle carries significant significance. The market respects this candle, whether it goes up or down, which is very important. Time Cycle often stops short near the candle. You will notice on the chart that it often looks like a support or resistance area.
Time Cycle candles also tell you about continuation or reversal, but you have to forgive the high and low of the candle formed in the time cycle.
You do not have to make any decisions yourself. This is its specialty.

Gold Maintains Bullish Structure Despite 4245 Rejection We have seen a sharp rejection from the 4245 level yesterday, forming a red candle . However,. Gold found solid support at the weekly R3 level around 4147 and managed to close above it, which is a significant technical development. Currently, we're witnessing a strong recovery rally on lower tf that suggests the bulls aren't ready to give up just yet.
When we zoom in to the daily timeframe, yesterday's downward move appears to be just a normal bearish candle rather than a trend reversal signal. The key factor supporting this view is that price was trading well above the weekly R3 level throughout the session. In a healthy uptrend, these kinds of pullbacks are quite normal and often provide opportunities for fresh entries. The overall bullish structure on the daily chart remains intact, which gives me confidence that this isn't the beginning of a major correction.
Looking at the current setup, the first critical support level at 4140-4150. This zone has proven its importance multiple times, and as long as price holds above this area, I'm maintaining a bullish bias. A daily close below 4140-4150 would be the first warning sign that we might be heading back into consolidation territory. That scenario would require a reassessment of the trend direction.
However, if gold continues to respect the 4140-4150 support zone and builds on today's recovery momentum, we could see price pushing toward higher levels in the coming sessions. The bulls have shown their presence at key support areas, and with the daily structure still favoring upside, the path of least resistance appears to be upward for now.

BUY TODAY SELL TOMORROW for 5%DON’T HAVE TIME TO MANAGE YOUR TRADES?
- Take BTST trades at 3:25 pm every day
- Try to exit by taking 4-7% profit of each trade
- SL can also be maintained as closing below the low of the breakout candle
Now, why do I prefer BTST over swing trades? The primary reason is that I have observed that 90% of the stocks give most of the movement in just 1-2 days and the rest of the time they either consolidate or fall
Cup & Handle Breakout in GOKULAGRO
BUY TODAY SELL TOMORROW for 5%

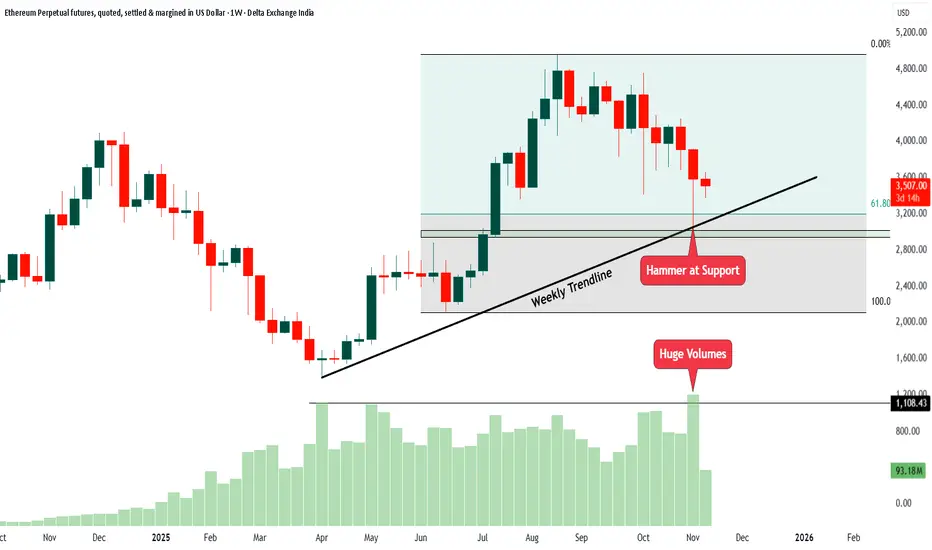
ETH Weekly Chart Analysis1. The price has been respecting a weekly trendline for many months. This trendline acts like a support line where buyers usually come in.
2. Recently, the price fell towards this same trendline and created a hammer candle. A hammer at support often shows that sellers pushed the price down, but buyers stepped in strongly and pulled it back up. This is usually a sign of buying interest.
3. The hammer candle formed exactly near the support zone and the Fibonacci 61.8 percent area. This area often works as a strong reversal point.
4. When the hammer candle formed, the volume was very high. Huge volume at support means big players were actively buying at lower levels.
5. The price is still inside a wide range between recent highs and lows. It has not broken out yet, but the support reaction is positive.
In simple words, the chart is showing a strong bounce setup from support with a hammer candle and high volume. This is a sign that buyers may try to take control again as long as the price stays above the trendline and support area.
How Businesses Can Grow in the Trading Market1. Understanding the Trading Market
The trading market encompasses multiple segments—stock trading, forex (foreign exchange), commodity trading, derivatives, and cryptocurrency trading. Each market functions under different regulatory, economic, and technological frameworks but shares a common goal: facilitating the exchange of value and risk between buyers and sellers.
For businesses entering trading, the first step to growth is a deep understanding of the market structure, participant behavior, and factors influencing price movements. Knowledge of supply-demand dynamics, macroeconomic indicators, and geopolitical influences helps in making informed trading decisions. Companies that invest in market intelligence and data analysis often find themselves ahead of competitors.
2. Building a Strong Trading Infrastructure
A key driver of growth in the trading market is technological infrastructure. In today’s environment, speed, accuracy, and connectivity define success. Businesses must invest in:
Trading Platforms: Using robust platforms like MetaTrader, Bloomberg Terminal, or proprietary systems ensures efficiency in execution.
Data Analytics Tools: Real-time data processing, AI-driven insights, and predictive analytics help in identifying opportunities early.
Connectivity and APIs: Fast internet connections and integration with exchanges through APIs enhance automation and scalability.
Cybersecurity: As trading becomes digital, safeguarding systems from cyber threats is essential for operational continuity and client trust.
A business that leverages advanced technology can scale operations globally while minimizing transaction errors and latency.
3. Strategic Diversification
One of the fundamental principles for business growth in the trading market is diversification. Relying on a single asset class or market exposes a company to unnecessary risk. Successful trading businesses diversify in several ways:
Asset Diversification: Engaging in equities, forex, commodities, and derivatives reduces dependence on one market.
Geographical Diversification: Expanding into international markets allows firms to capitalize on regional opportunities and time-zone differences.
Product Diversification: Offering products like ETFs, mutual funds, or structured products can attract a broader client base.
Diversification not only stabilizes revenue but also opens multiple income streams that cushion the impact of market volatility.
4. Leveraging Technology and Automation
Technology plays a transformative role in the trading market. Automated and algorithmic trading systems have revolutionized how businesses operate. Algorithms can execute large volumes of trades within milliseconds based on pre-set strategies, removing emotional bias and increasing efficiency.
Key technological advancements supporting business growth include:
Artificial Intelligence (AI) and Machine Learning (ML): AI helps forecast price movements using pattern recognition and big data analysis.
Blockchain Technology: It enhances transparency and reduces settlement times, especially in cryptocurrency and cross-border trading.
Cloud Computing: Enables real-time access to trading data and remote operation, allowing global teams to collaborate seamlessly.
Firms that embrace automation and digital transformation gain a competitive advantage through reduced costs, higher accuracy, and faster decision-making.
5. Developing a Risk Management Framework
Trading is inherently risky due to market fluctuations, leverage, and liquidity issues. Businesses can grow sustainably only when they balance risk and reward. A strong risk management strategy involves:
Position Sizing: Limiting exposure per trade to a fixed percentage of total capital.
Stop-Loss Orders: Automatically exiting losing trades to prevent large losses.
Hedging: Using derivatives like options and futures to protect against adverse price movements.
Stress Testing: Simulating different market scenarios to assess potential impacts on the portfolio.
Risk management not only safeguards capital but also builds confidence among investors and clients.
6. Regulatory Compliance and Transparency
Growth in the trading market depends heavily on maintaining regulatory compliance. Governments and financial authorities such as SEBI (India), SEC (USA), and FCA (UK) impose rules to ensure fair trading and investor protection. Businesses that adhere to these regulations gain credibility and attract institutional clients.
Transparency in reporting, accurate record-keeping, and ethical conduct are vital for long-term growth. A reputation for integrity can distinguish a trading firm in a competitive marketplace.
7. Building a Skilled Team
A successful trading business requires a mix of analytical, technical, and strategic expertise. Recruiting skilled professionals—traders, analysts, risk managers, and developers—creates a strong foundation for growth. Additionally, ongoing training ensures the team stays updated with market trends, tools, and compliance requirements.
Companies should encourage knowledge sharing, foster innovation, and provide performance-based incentives. Human capital remains one of the most valuable assets in trading operations.
8. Adopting Data-Driven Decision Making
Data has become the new currency of the trading world. Businesses that leverage data effectively can identify trends, forecast market behavior, and optimize trading strategies. Using big data analytics allows traders to process massive volumes of historical and real-time information for better decision-making.
Predictive analytics tools can detect early signs of market shifts, while sentiment analysis (e.g., through news or social media data) provides insights into investor psychology. Data-driven approaches minimize guesswork and enhance precision.
9. Strategic Partnerships and Networking
Collaborations with financial institutions, liquidity providers, and technology vendors can accelerate growth. For instance, partnering with brokers or fintech platforms enables access to liquidity pools and advanced market tools. Networking at global financial conferences or online forums also helps in building relationships that open doors to new opportunities and insights.
Strategic alliances expand reach, enhance credibility, and reduce operational costs through shared resources.
10. Marketing and Branding in the Trading Sector
In a competitive trading environment, marketing and brand differentiation are crucial. Businesses must position themselves as reliable, transparent, and technologically advanced. Effective strategies include:
Content Marketing: Publishing insightful market analyses and trading education to attract clients.
Social Media Presence: Using platforms like LinkedIn, X (formerly Twitter), and YouTube to engage traders.
Client Support and Service Quality: Building trust through prompt assistance and transparent communication.
A strong brand helps attract both retail and institutional clients, fueling growth.
11. Expanding into New Markets
Globalization has made it easier for trading businesses to enter emerging markets where trading activity is growing rapidly. Markets in Asia, Africa, and Latin America offer rising participation and economic potential. Understanding local regulations and customizing products for regional demand helps in capturing new audiences.
Expanding internationally diversifies revenue and increases resilience against downturns in any single economy.
12. Continuous Innovation and Adaptability
The trading market evolves constantly with changing technologies, regulations, and investor preferences. To grow, businesses must remain adaptable—embracing new tools like decentralized finance (DeFi), sustainable investing, and tokenized assets.
Innovation in products, strategies, and services keeps a firm relevant and competitive. Regular review of trading models ensures alignment with current market realities.
Conclusion
Growth in the trading market is not achieved overnight—it results from a blend of strategic planning, technological investment, skilled management, and disciplined execution. Businesses that focus on diversification, automation, risk management, and compliance can build a robust foundation for sustainable expansion.
In a world where financial markets are interconnected and data-driven, success depends on how well a business can adapt to change, leverage technology, and maintain trust. By combining innovation with prudence, any trading enterprise can evolve from a small participant to a global leader in the dynamic world of trading.

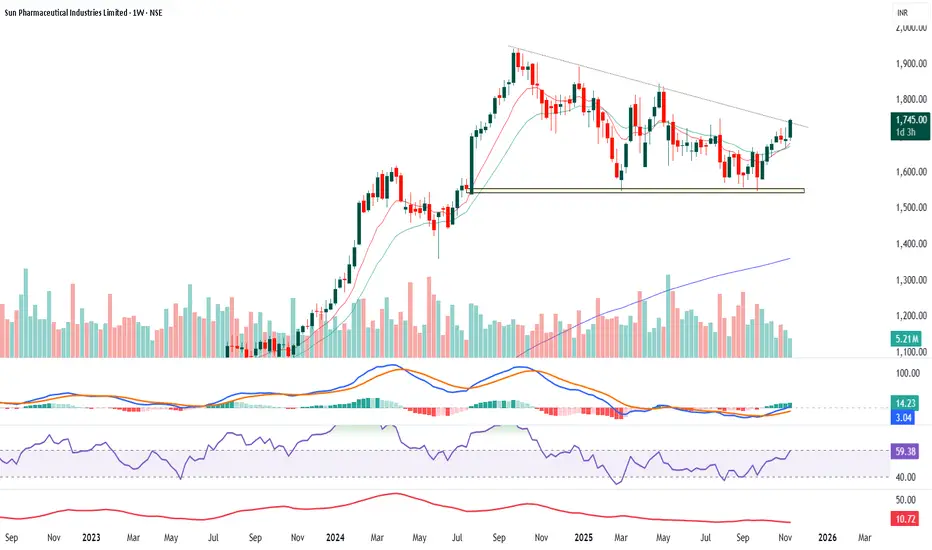
SUNPHARMA - Weekly- LONGA simple and clear analysis of the Sun Pharma weekly chart based on trend, volumes, momentum, RSI, ADX, and chart structure:
Trend: The stock has been in a broad consolidation for many months. It was making lower highs, forming a downward sloping trendline. Now the price is trying to break above that trendline. This shows the first sign that the downtrend may be ending and a fresh upward move may start. The long-term trend is still positive because the price has stayed above the major support zone around 1550–1600.
Chart pattern : The chart is showing a descending trendline with multiple touch points. The stock has bounced strongly from the support zone and is now testing the trendline. A clean breakout above this trendline will confirm a trend reversal.
Volumes: Volumes have been stable but not very strong. However, during recent green candles, volumes have slightly increased, which shows buying interest returning slowly. A breakout with higher volume will give more confidence.
Momentum (MACD)
The MACD has crossed above the signal line, which indicates bullish momentum building up. The histogram turning green also supports the idea that the momentum is improving.
RSI : RSI is around 59, which means the stock is gaining strength but is still not overbought. This is a healthy zone for an early-stage uptrend.
ADX : ADX is around 10, which indicates that the current trend strength is weak. It means the stock was in a range for a long time. As price breaks out and ADX starts rising, the new trend will get stronger.
Overall view : Sun Pharma is showing early signs of a trend reversal. Price is near a trendline breakout, momentum indicators have turned positive, RSI is rising, and the stock is holding a strong support zone. A confirmed breakout above the trendline with good volume can start a fresh upward move.
RELIANCE 15MININTRADAY TRADE
- EARN WITH ME DAILY 10K-20K –
RELIANCE Looking good for upside..
When it break level 1520 and sustain.. it will go upside...
BUY@ 1520
Target
1st 1536
2nd 1552
FNO
RELIANCE NOV FUT – LOT 7 (Qty-3500)
RELIANCE NOV 1490 CE – LOT 7 (Qty-3500)
Enjoy trading traders.. Keep add this STOCK in your watch list..
Big Investor are welcome to join the ride ..
Like this Post??? Hit like button..!!!
Follow me for FREE Educational Post and Alert..
